Streaming charts paint the most relevant picture, because there’s no time like the present!
We’ve all sat there after something happened, analysed the information and made perfect sense of it…
But nobody gets paid for after-timing, unfortunately. You need to understand what is happening and why, in the moment, while there’s still an opening to exploit your edge.
The best solution? Streaming charts.
This is why we’ve knocked up this handy guide to setting up your streaming charts for Betfair trading.
Streaming Charts Advantage?
If it wasn’t clear already, here are three of the main reasons its advisable to use streaming charts.
- React Faster – see real-time information, as it happens.
- Visual Aide – clarity is key. A visual picture is obvious.
- Multiple Chart Types – specific data can be singled out (i.e. volumes).
- Customisable Settings – fit streaming info to your needs.
Being set up correctly and analysing information within the same parameters can throw out interestingly repetitive patterns…
It’s no secret; history often repeats itself, people are creatures of habit. The trick if ever there was one, is to recognise a historic pattern as it begins to develop once more.
In order to do this, you’ll need to be set up correctly…
Recommended Settings
If you use Geekstoy, Bet Angel or Gruss it doesn’t matter. They all have the same functions, albeit at different price points.
Different sports and setups (in-running / pre-race) will have different priorities and requirements. Customising your streaming charts to fit is wise. For the sake of this article, I’ll be showing examples via the AGT Pro as it’s the most customisable.
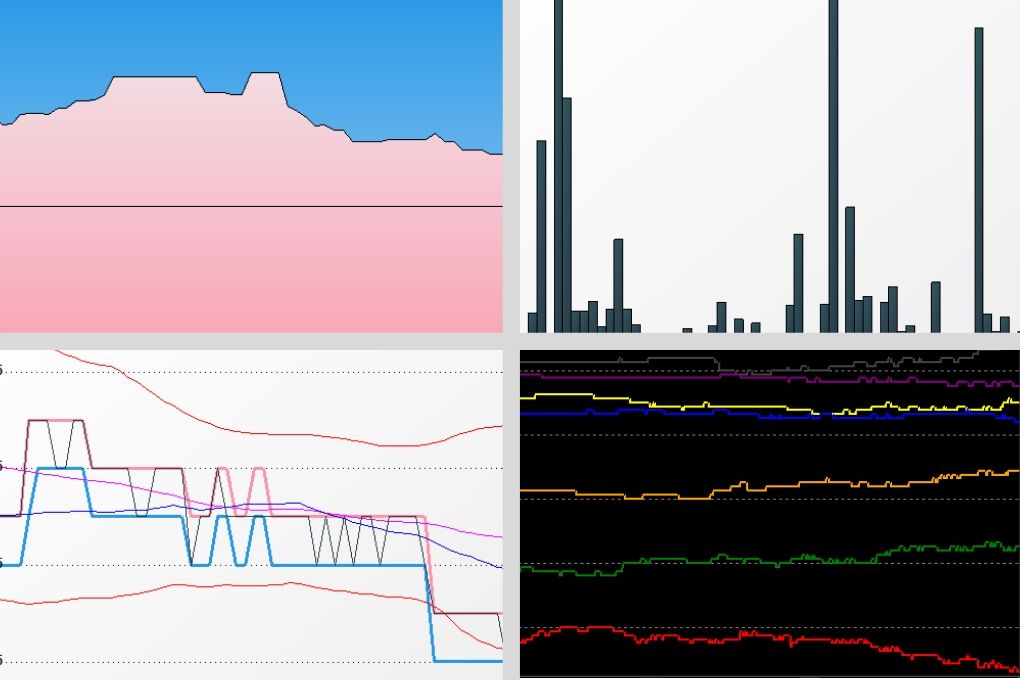
Below are my settings for 4 of the most useful streaming charts…
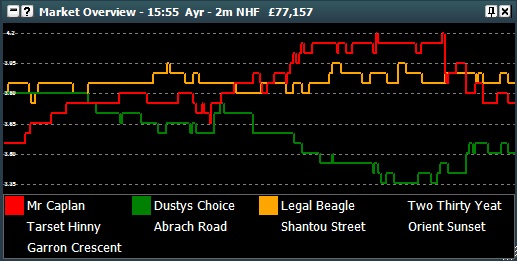
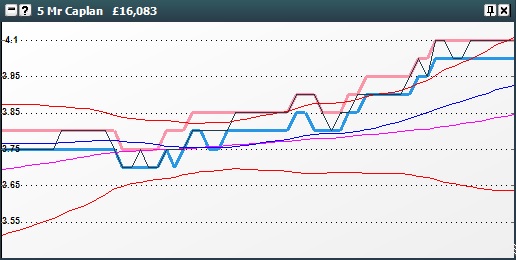
Market Overview (MO): Streaming Info
Staring with the most useful, the MO streaming chart. Designed to help you notice sudden changes in market activity and relationships between prices.
The MO is a broad but important source of streaming information.
For a pre-race trader, the following settings are advised:
- Range: 0.25 or 0.33 seconds.
- Refresh rate: 180 to 300 seconds.
- Reason: the majority of pre-race activity is in the final 5 minutes.
All individual chart settings can be adjusted via the streaming charts sub-menus (right-click).
Traded Volume Streamed Live:
It’s crucial you work market volumes to your advantage. Streaming volume data is a strong indicator in many situations, depending on the context you use it – the timeframe is variable.
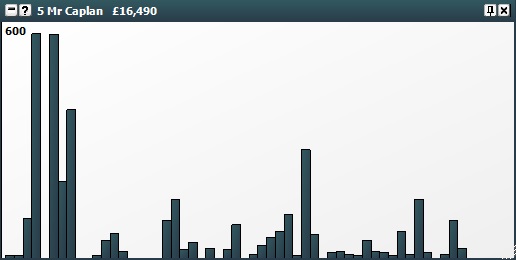
For the sake of pre-race trading, I like to keep it short-term. There are other ways to interpret longer-term volume…
- Range: 10-20 seconds.
- Refresh rate: 0.5 seconds.
- Reason: super-responsive streaming chart for immediate understanding.
This one can be a godsend in the right situation.
Price Lines…
I don’t personally use this chart anymore. However, I did at one point!
It’s a useful overview of price activity on individual selections, similar to MO. Lines express historic movement of both back and lay…
- Range: 180 to 240 seconds.
- Refresh rate: 0.25 seconds.
- Reason: medium-term expression of streaming data.
Weight of Money (WOM) Chart Settings
Not sure what this is? Here’s a full explanation of weight of money.
Use of this streaming information is limited because it can be manipulated. However, don’t write it off too fast!
Streaming WOM information can help you identify ‘spoof’ money around the active prices.
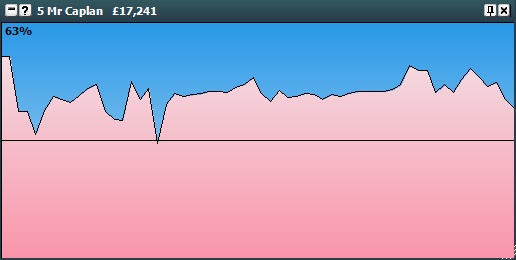
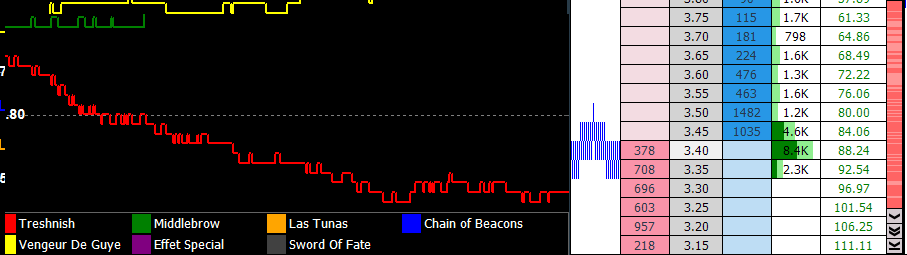
The overall WOM value is expressed on the ladder inside the Geekstoy too (top of each column). In this example, WOM is at 63%.
- Range: 120 to 180 seconds
- Refresh rate: 0.25 seconds.
- Reason: assist a broad understanding of unmatched bets.
Hopefully, this was a useful post for all readers, happy streaming!
Advanced Help: Video Pack Training Course
2 thoughts on “Streaming Charts Guide (Includes Settings)”
Thanks Caan,
I’ve been studying chart analysis for several weeks now and recognising emergence of repeated daily patterns. Still a long way to go…
I think the real time info you have touched upon bove will add confirmation to some of my ideas, particularly where volume is concerned.
Are all of the charts above screen shots from Geeks Toy?
Hi Shaun,
Certainly, volume is very important. Streaming charts are most important because of their immediate relevance.
All images are with GT yes.
Caan