Recognising and understanding patterns around human psychology is extremely profitable.
For me, this was one of the most obvious trading thesis to pursue. People just can’t stop themselves, emotional reaction is built into our DNA, it’s everywhere. The exchange markets are a perfect example!
Now, I’m going to show you how and why one or two patterns appear in the market…
Before we get going, we need to define the meaning of two things.
-
- Breaking points
- Support and resistance
When I refer to a ‘break in price’ throughout this article, I’m talking about the point at which indecision is overcome in the market. Some prices are worse for it than others, although it shouldn’t always be assumed as a fixed numerical point.
Support and resistance is simple, as the name suggests. Support is in favour of a price shift and resistance is working against it.
Logical Explanation:
The majority of betting exchange volume is down to a small portion of users, fact.
Just how heavy the skew between trader and punters money is, I don’t know. In the past, others have suggested 70% of the money matched on the exchange is traders.
So when you think about it, all this excess money sloshing about can’t be at value. There has to be a whole host of over-reactions, under-reactions, mistakes, ego, emotion, and indecision at play…
The very fact there is more money than value means there will be excessive reactions. Human emotion just makes things more choppy (and predictable).
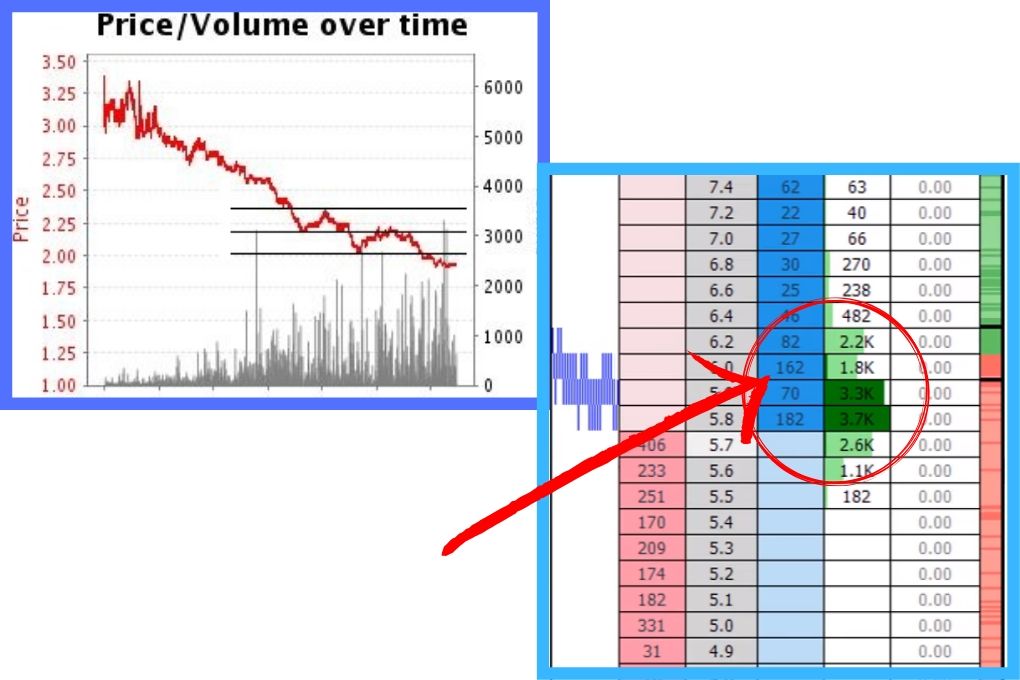
Take a look at this image…
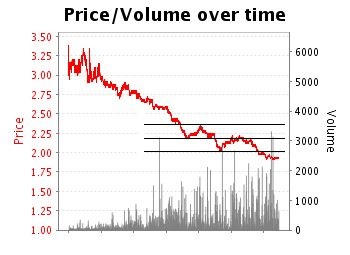
See the red line puckering up at similar points? (intersected by the black).
These points of indecision are breaking points. Pressure builds in the market as support battles resistance, when one side of the equation is overpowered the price shifts.
But that’s not all.
From a psychological standpoint, this is interesting. Not only has the market decided it’s true direction, but there are also a group of traders (forming a large portion of market volume) who need to exit their losing position. This is why the price doesn’t move in a smooth line.
Some people are particularly stubborn. They don’t want to exit their position at a loss, so their exit (should they achieve it or not) is a similar point to where they entered. This is also why a previous resistances regularly become support. If you look to the header image on this article the red arrow points to a previous breaking point. Funny how there’s more money there. Also, notice how there’s a spike in volume matched after shortening through the 6.0 price.
Coincidence? I think not.
But realising the market is partly a collection of traders constantly tripping over each other is only half the battle. To steal the safest profit possible, we need to open a position as the price breaks!
Recognising a Break Early…
This leads to the following question: how do you spot a potential breaking point?
Often, there are advanced clues via the traded volumes, race make-up, location, people involved and market stability.
However, you don’t need to predict the future. It’s far easier (and safer) to wait until a price has already broken, read the weight of movement and ride the middle segment. Why take more risk than you have to?
This, of course, requires you to be decisive when decision-making.
It’s worth bearing in mind, there’s less resistance if the market has traded there previously. Also, in places, the market naturally forms additional resistance (something that’s discussed in the trading guide further).
Last but not least, spending a little time with the information on offer can really help you develop a deeper understanding of how market psychology works…
5 thoughts on “Why Resistance Breaks Become Support…”
Enjoyed this one Caan. I have been scalping these resistance points profitably for a while. Thanks for all your help on the forum and YouTube.
No problem at all, Gareth. We do our best to be the best! 🙂
Thanks for this article Caan.
Could you please explain what is a weight of movement – it is measured in ticks or in money volume?
And how to ride the middle segment of this movement? You mean – when it bounces back?
Thanks!
Andrew.
Hi Andrey, the weight of movement is like the weight of money, but with matched money! How you trade it is unique to the situation. There’s a chunk about it in the pre-race trading guide.
Hi Caan
Do handicap races often exhibit these resistance & support points also, maybe to utilise some directional scalping? Or less of an indicator with handicaps?
Thanks