Looking for the best stats-based prediction side for football betting? This is the post for you.
Infogol is my top recommendation as one of the best free resources to improve your football betting and more importantly; help you fully understand how the game has gone.
Football is an emotional sport, and we all have favourites and teams we dislike. This means there is always an element of bias within the game, how likely a striker was to score or who created the most chances isn’t always reflected within market odds. Having the right tools and knowing how to use them can help you unravel the puzzle, be it ELO ratings or any other method.
So in this mini-review, I’m going to explain what Infogol has to offer, why I favour it myself and how it can help your football betting and trading skills.
What is Infogol?
Simply put:
a statistical app, displaying historical data in an efficient way that helps the end-user measure the likelihood of future football outome.
Every goal attempt in football has a probability of scoring. Infogol takes into account years of historical data and puts a probability on each shot. This, in turn, generates an xG (Expected Goals) which tells Infogol users who “should have” won the game. This is a superb tool for anyone who likes betting, trading or is just a fan of understanding football stats. Infogol will tell you exactly how a team played and what outcome the game “should have” had on average if it were replayed many times over.
Let’s look at an example:
You can visit Infogol here for yourself.
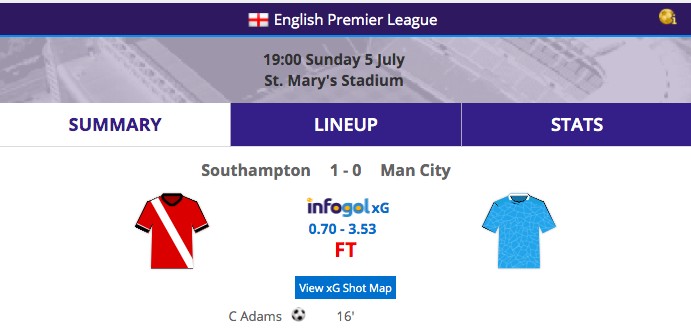
This was a game from the 2019/2020 Premier League season when Southampton shocked Manchester City. Look at the figures under Infogol xG though – Manchester City created an xG of 3.53 while Southampton didn’t even create an xG of 1.
Manchester City was incredibly unlucky to lose and performed well.
This is important, because football is full of narratives and bias commentators. You can easily fall for the line that Southampton shocked Manchester City and City are finishing the season poorly. However, by looking at Infogol we know that is not the case – City actually played really well and show signs of being in excellent form.
How does this help your trading and betting?
Well, that’s obvious. The final result showed City lost but the underlining numbers shown they played very well. Going into their next game, they are in great form, they just didn’t get the result to show.
What did City do in their next two games? Well, take a look for yourself…
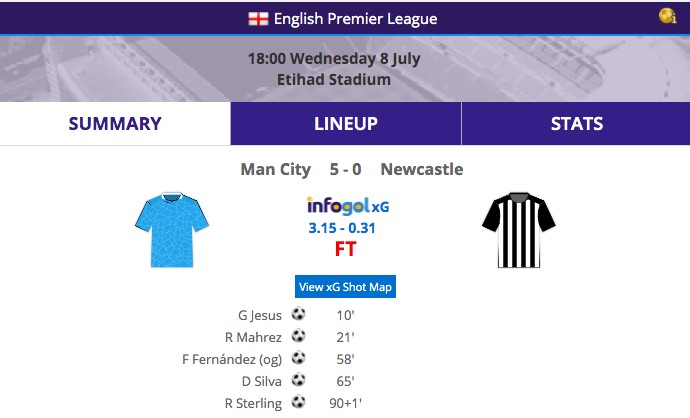
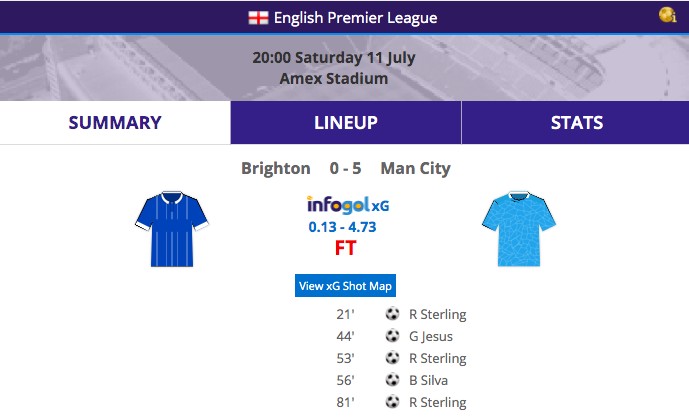
As you can see, Infogol allowed us to really see who is in form and performing to their best ability before a football match. It also shows how the game has gone, factually.
A team may appear on top to the naked eye but are they actually creating enough chances, probability wise, to win the game? Infogol displays this clearly.
Understanding Infogol xG (Expected Goals)
xG (Expected Goals) is just another way of understanding how a football game was played. Every shot creates an xG, which is just a probability of the player scoring.
The probability range goes from 0 to 1, with 1 being a goal obviously. It’s very rare that you get a chance with a probability of 100% though!
For example, the average penalty has an xG of 0.78 meaning that for every 100 penalties, 78 will be scored.
The higher the xG at the end of the game, the stronger the performance from the team in question. xG is a fantastic tool for trading and betting on football because it allows you to really see how a team is performing. For example, if a team has lost their last three games but xG says they should have had two wins and a draw. The average punter will underestimate their chances in their next game but xG shows they have been playing well, and they will soon reflect their solid performances.
xG is a complex method of putting a probability on each chance but it is very accurate even allowing for some criticisms. It takes in multiple factors based on years of data on each recorded shot. Some variables xG focuses on are:
- Distance from goal
- A set-piece or open play
- Angle of shot
- Shooting part of the body (head or foot)
- Where did the chance come from (rebound, opening play, through ball, etc etc)
Infogol puts every together and you get a probability for each shot based on the above and taking everything into account.
Infogol Shot Maps:
If you thought that xG was difficult to understand or a lot to focus on then, then understand this: you don’t have to understand how xG works to actually use it! Let Infogol do all the hard work, just focus on the xG number – not how it was calculated. This is where shot maps come in very handy.
See a brief YouTube video about Infogol shotmaps here.
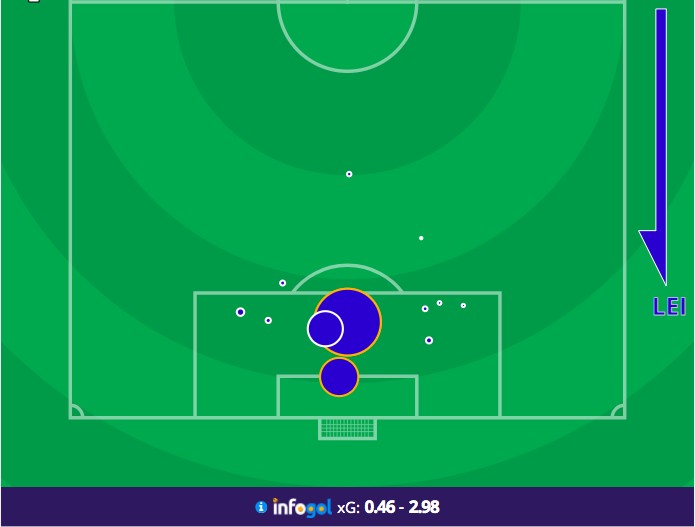
Infogol shot maps display under the stats section of each fixture. They allow you to see where the chance came from, who took the shot and what probability it had of scoring. It’s a very easy graphic to use – all you have to do it click on the circle and up pops the chance and probability. It’s an exceptionally handy tool to quickly understand who was on top in the game.
Take a look at this shot map from Leicester against West Brom.
They won the game 3-0, creating an xG of 2.98, suggesting that the game went exactly as it should have.
Infogol App, Results And Football Statistics…
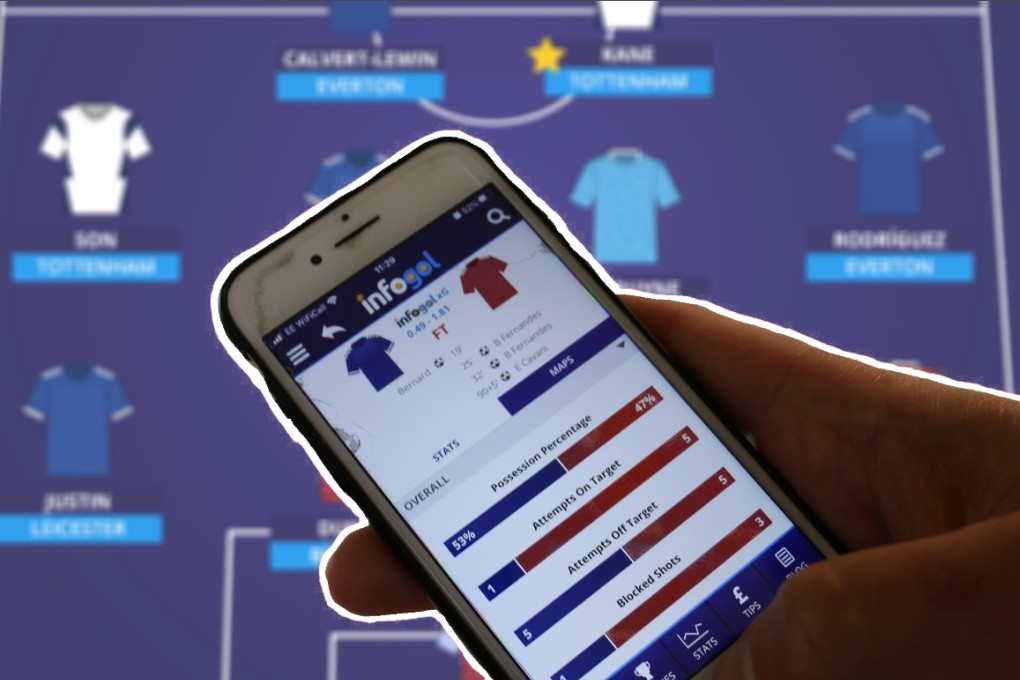
These days, everything is on mobile. The Infogol App is very easy to use and I use it daily to check results, stats and how games are going in-running. It’s such a helpful tool to show who was on top and did the result reflect the performance.
A lot of football betting is backed up with stats these days, but are they the right stats?
I don’t place much importance on head-to-head stats like you see on Sky Sports. I’d rather see the underlining performance numbers for the team in question over the last six games. Imagine backing Manchester United because of their historical head-to-head record with Manchester City these days – you wouldn’t do it. However, you would if United’s xG figures were impressive, and they offered a bit of value heading into the clash.
Using Infogol For Football Predictions:
Infogol has an absolute wealth of data that can help with football prediction. I’m going to run through what areas to focus on and what markets on Betfair the data can be linked too.
Match Odds & Goal markets will have the most money on Betfair, and they are clearly the most popular!
For match odds, I focus on recent form and the xG’s that the teams have recorded to see are they in good form. For example, check out the picture below:
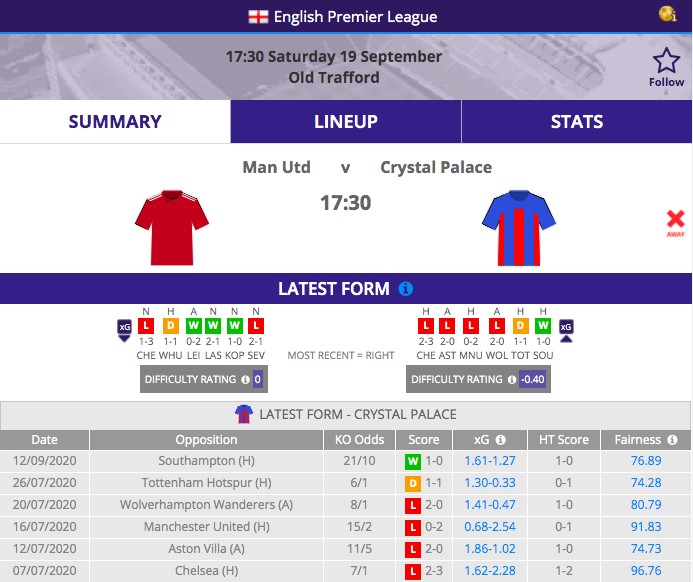
Using xG as a guide to how teams played is very simple. If you don’t create chances, you don’t win games – if you give too many chances away, you will end up losing games. You can see looking at the Crystal Palace results and xG that there weren’t any major hard-luck stories from them in their recent games. All games pretty much went as they should have.
You can use xG for goal markets too. I especially like when teams are giving up chances, that is called xGA – Expected Goals Against. Usually, teams that give up an xGA of over 2 per game are excellent for backing overs because they play such an open game. The Bundesliga stats are incredible and this is often backed up on the pitch with loads of goals.
Take a look at the next graphic:
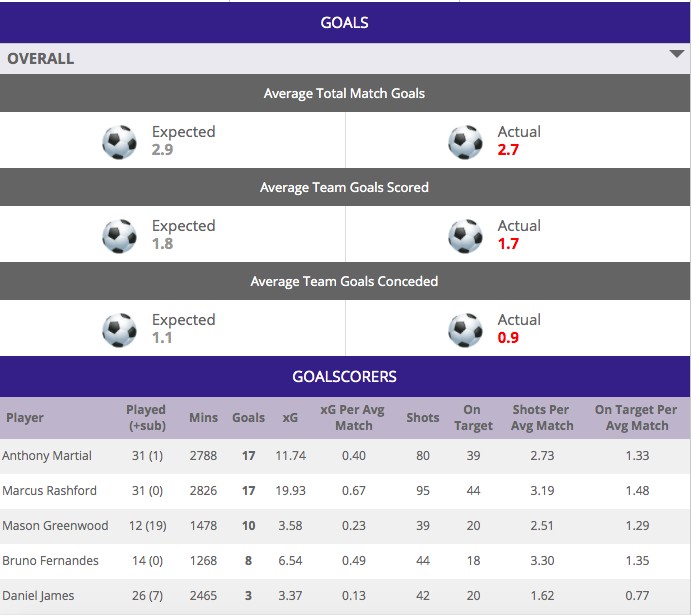
You can see that Manchester United pretty much perform in line with xG over the course of the 2019/2020 Premier League season. Although they should have seen more goals in their goals, conceding less than expected and also scoring less than expected. Stats like these are always helpful when trading the goal markets, and we also have some very interesting player stats too. Markets always move because of team news and with all these stats available, we can fully understand which players are more important than others and reflect that in our trading.
The above example of Manchester United is good because Martial is clearly their star man, but in terms of xG Rashford and Fernandes actually create a higher xG. All three are key to Manchester United, but we might see a market over-reaction if Martial is left out this season for example.
In reality, you can link Infogol to any market – cards, corners, correct score, you name it.
Understanding Infogol Ratings
In the above graphics, you may have noticed some ratings. These are often on the right-hand side when looking at a result, as you can see if the above graphic with Crystal Palace. Infogol applies a fairness rating to each result. This is very helpful when you’re looking at results and want to save time. It is scaled from 0 to 100, with a result closer to 100 meaning that the result is reflected in xG.
For example, if Liverpool beat Chelsea 2-0 and the xG was 2.2 to 0.4 then that game would have a fairness rating very close to 100. If the xG was 0.8 to 2.5 then you would see a fairness rating of under 50 because clearly Chelsea created more and should have won the game with an xG of 2.5 to 0.8!
Infogol Tips and Football Trading:
First of all, if you don’t understand what sports trading is, check out our free beginner’s school here.
Infogol has some really nice previews of the big games that are very easy to read and packed with information. I fully suggest using them to improve your football knowledge before trading a market. It can only help.
Once you have all this knowledge at your fingers tips, it’s time to put it into action within the football markets on Betfair. My suggestion would be to look for games that stand out to suit your trading strategy. For example, if you like scalping under 2.5 goals then use the Infogol data to find teams that are slow starters and don’t score many early goals. If you like to lay the draw when teams are level heading into the final 15 minutes, look for teams with the best record of late goals and a high xG. Then compare that with the in-running data that Infogol provide throughout the game and see are they creating enough chances to suggest a goal is coming.
xG is improving all the time and it’s only going to keep growing within football. Most of the top football clubs around the world are already using the data to analyse their own performance, so why aren’t you?
3 thoughts on “Infogol Guide: Best Football Statistics App?”
Is Infogol still around all I get is a link to the Sporting life website?
Great post! I’ve been searching for a reliable football statistics app, and this guide really helped narrow down my options. I appreciate the detailed comparisons and insights. Can’t wait to try out Infogol!
Good